Conversion rate optimization (CRO) is about improving your website’s ability to turn visitors into customers. The stats below show where businesses stand today-where they often get stuck, and where the biggest opportunities are to make changes that get better results.
What is Conversion Rate Optimization?
Attracting visitors to your website is only the starting point. Companies often put money into advertising, SEO, and social media, but if those visitors leave without engaging, the investment falls short.
Conversion rate optimization (CRO) ensures that traffic turns into real results. By improving site usability, building trust, and offering clear direction, CRO makes it easier for people to complete actions such as buying, signing up, or reaching out, all without unnecessary pressure.
Website traffic can be compared to window shoppers, while conversions represent paying customers. A slow, confusing, or poorly designed site drives people away. CRO removes these obstacles so more visitors take action, giving greater value from the audience you already have.
Now that you understand what CRO is, learn how to use it successfully with these 7 conversion rate optimization tips designed to dramatically increase your conversions and online success.
Why Conversion Rate Optimization Matters?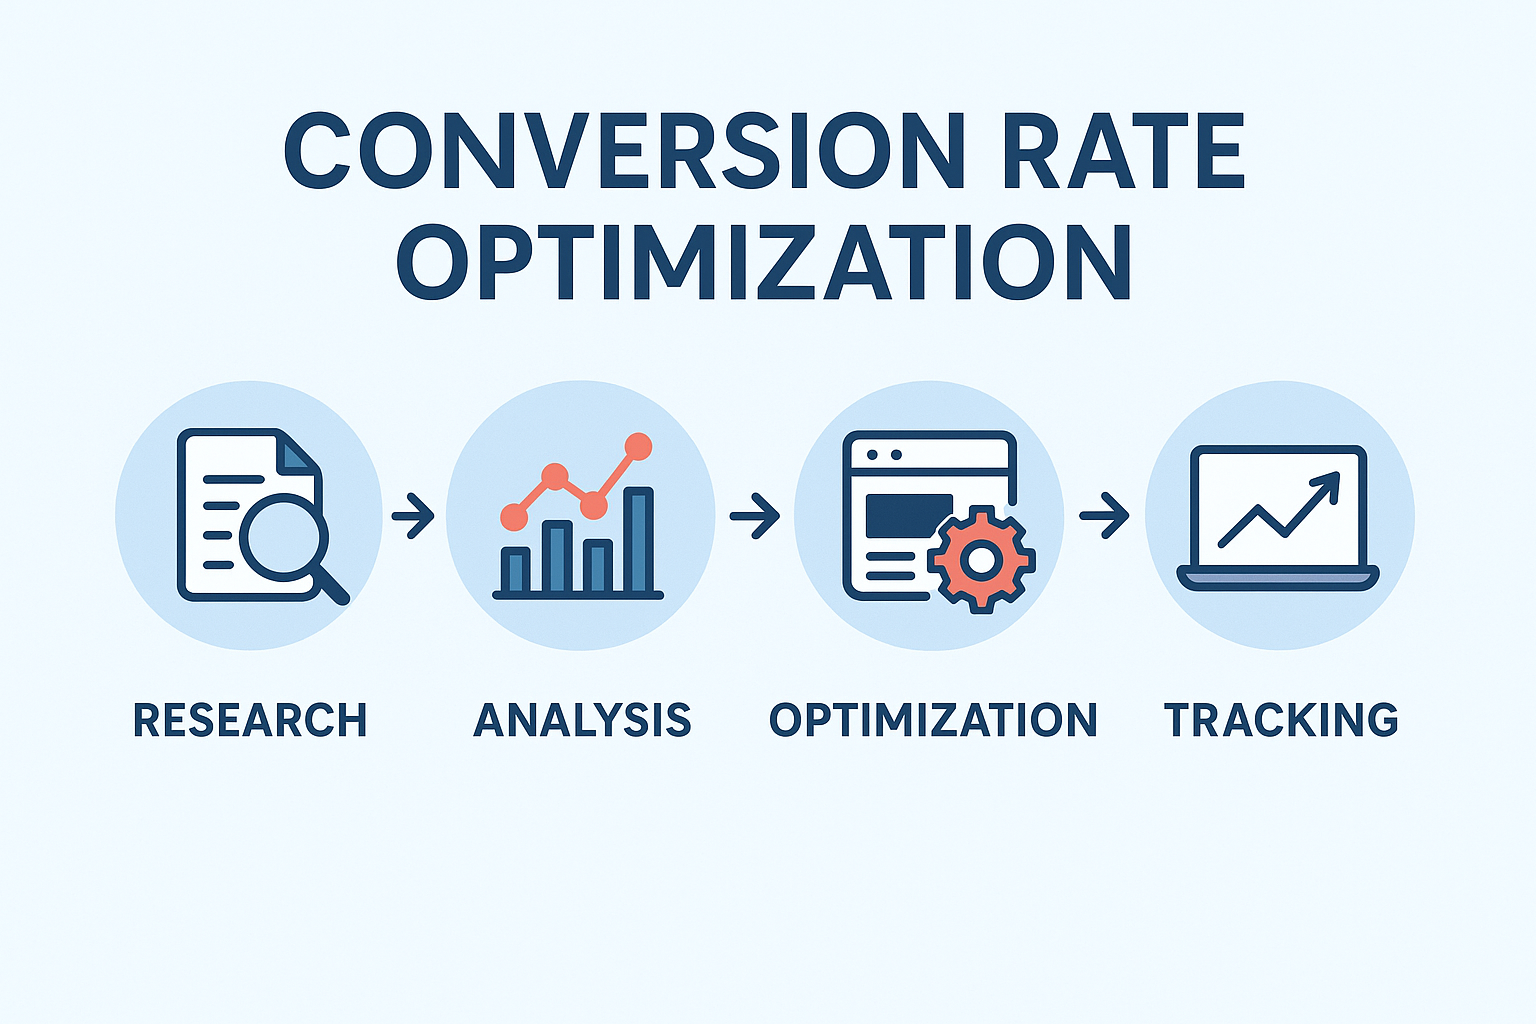
Increasing website traffic is only the first step. You might spend a lot of money on social media, SEO, and advertisements, but you won’t get any results if visitors don’t do anything when they get there.
Conversion rate optimization is critical in this case. CRO transforms clicks into customers by improving site navigation, building trust, and offering clear instructions for visitors to perform actions such as purchasing, registering, or enquiring.
Here’s a straightforward comparison: traffic is similar to customers passing your store. Conversions are those who visit and make a purchase. People will quit your site if it is difficult to use, slow, or unclear. CRO reduces those friction points—so you gain more value from the visitors you currently have.
55 Timeless Conversion Rate Optimization Stats
These statistics show common business practices and problems that directly affect conversion rates, giving businesses valuable insight on where to concentrate their optimization efforts.
General Conversion Rate Optimization Stats
These important data summarize the current status of conversion rate optimization, highlighting the challenges and possibilities for firms looking to increase performance.
- Slow pages cut conversions by 7% (BigCommerce)
- $1 spent on CRO vs. $92 on acquisition (HubSpot)
- Landing page videos boost conversions by 80% (VWO)
- AI-driven CRO testing to hit 30% adoption by 2025 (Gartner)
- CRO tools deliver 223% average ROI (99firms)
- Only 39.6% document CRO strategies (HubSpot)
- 22% of businesses satisfied with conversion rates (HubSpot)
- 25% face issues from outdated tech (99firms)
- Most CRO teams have 2-25 members (Kobiton)
- A/B testing is a top CRO method (Adobe for Business)
Page Elements That Improve Conversion Rates
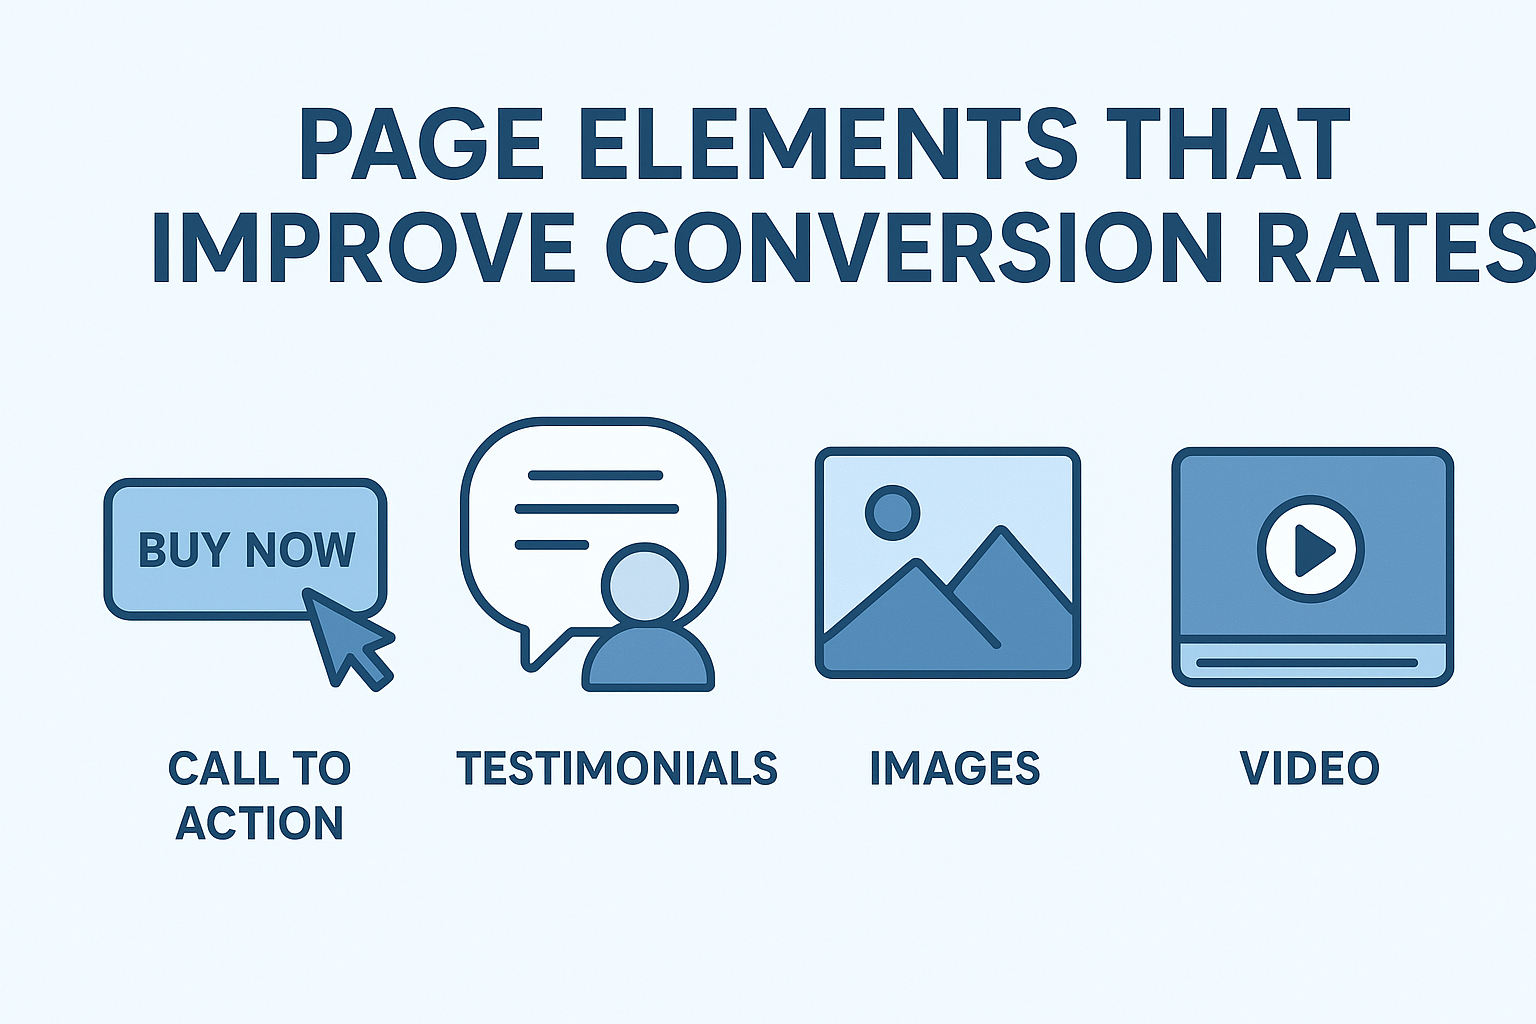
Little changes to your web pages may make a big effect. By incorporating aspects that build trust and assist visitors, you may greatly improve the number of individuals who act.
- Gather More Customer Reviews: Aim for 50+ reviews—volume builds trust and can boost conversions by ~5%. (LinkedIn)
- Add a Video to Your Landing Page: Videos improve engagement and can boost conversion rates by up to 86%. (HubSpot)
- Place CTAs Above the Fold: Enhances visibility and has the potential to increase conversions by 317%. (Medium)
- Use Exit Pop-ups: Timely offers or messages can add 2–4% more conversions. (OptinMonster)
- Enable Live Chat: Real-time support builds trust and can boost conversions by 40%. ( hiverhq)
- Write Question-Style Titles: Titles with questions get ~15% more clicks. (Backlinko)
- Add Clickable Text CTAs in Blogs: Can increase conversions by 121% by guiding readers to act. (invespcro)
General Conversion Rate Optimization Statistics
These statistics show how companies structure their CRO efforts, the common challenges they face, and the impact of customer behavior on conversion outcomes.
- 40% of companies lack a clear CRO owner: In many businesses, CRO responsibility is unclear: 41% have no owner, 30% use a team approach, and only 29% assign one dedicated person. (thegood)
- 79% of leads don’t turn into sales: More than half (56%) of leads aren’t ready to buy, showing the challenge of moving prospects down the funnel. (Demandsage)
- 63% of shoppers buy online after a positive in-store experience: Offline interactions strongly influence online purchasing behavior. (WebFX)
- 58% of marketers struggle with lead quality: Generating leads that actually convert remains one of the hardest challenges. (Reach Marketing)
- 82% of marketers find CRO tracking difficult: Most report that tracking and testing conversions is highly or moderately challenging. (Market.biz)
- Post-COVID CRO challenges: Companies face issues with executive buy-in and process improvement, making adoption harder. (Market.biz)
CRO Implementation Statistics
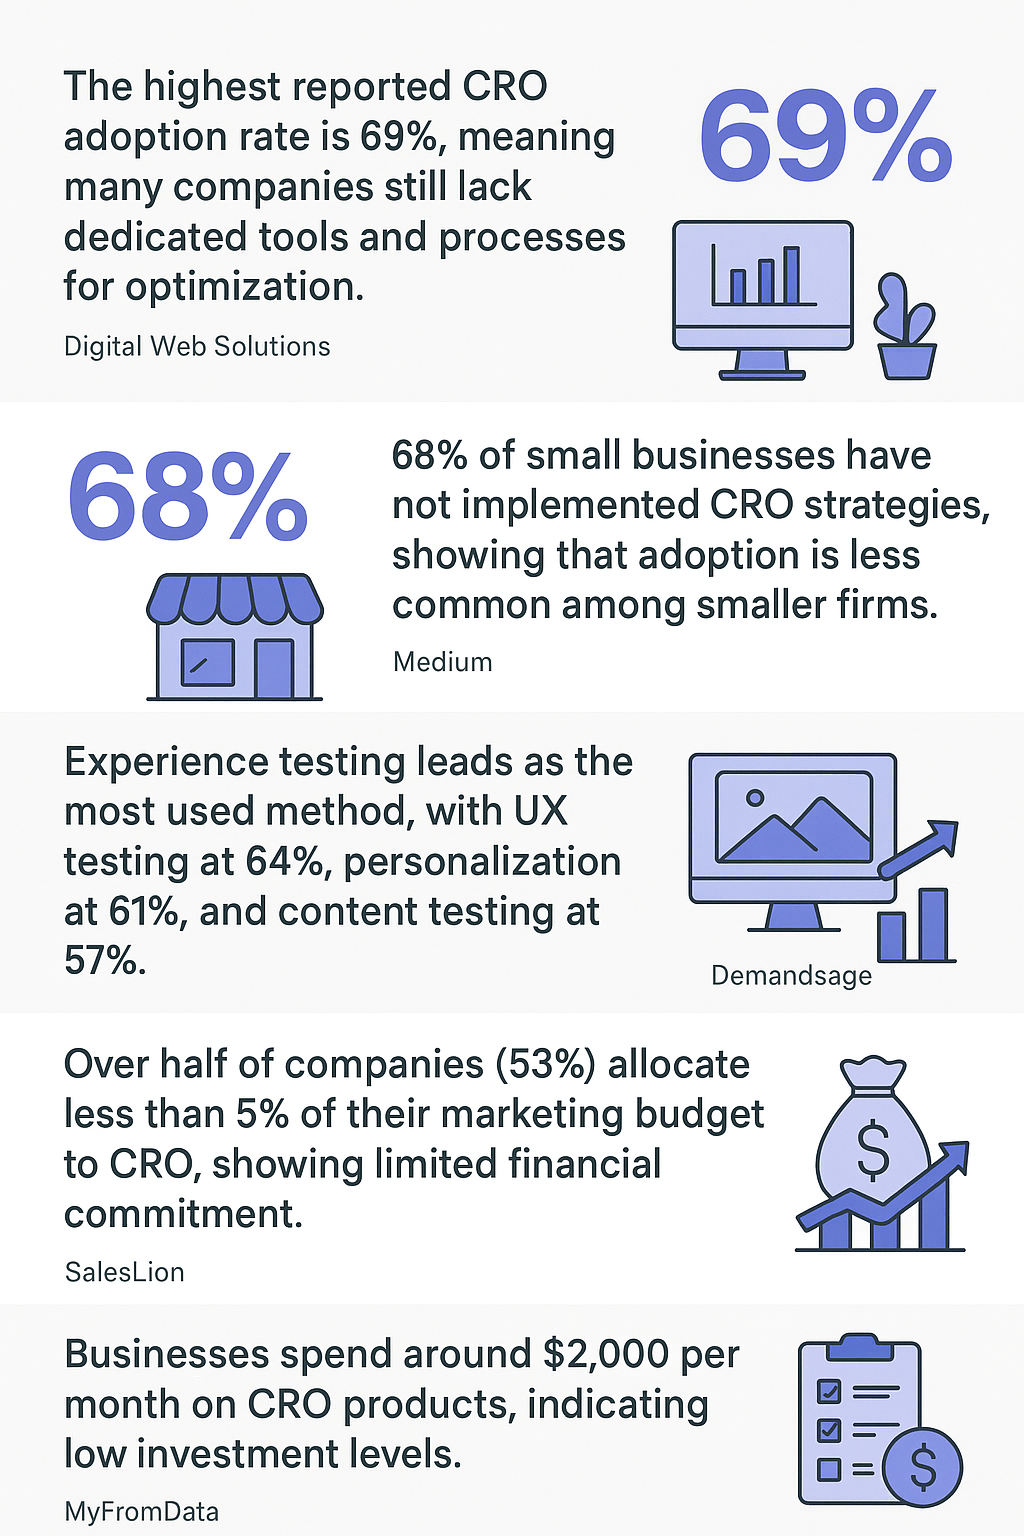
Despite the benefits of conversion rate optimization, adoption rates vary greatly amongst companies, with many still underinvesting in CRO tools and procedures.
- The highest reported CRO adoption rate is 69%, meaning many companies still lack dedicated tools and processes for optimization. (Digital Web Solutions)
- 68% of small businesses have not implemented CRO strategies, showing that adoption is less common among smaller firms. (Medium)
- Experience testing leads as the most used method, with UX testing at 64%, personalization at 61%, and content testing at 57%. (Demandsage)
- Over half of companies (53%) allocate less than 5% of their marketing budget to CRO, showing limited financial commitment. (SalesLion)
- Businesses spend around $2,000 per month on CRO products, indicating low investment levels. (MyFromData)
- Only 39.6% of businesses record their CRO plans, making it difficult to measure results, exchange information, and sustain constant progress. (Scoop)
CRO Spending and ROI Statistics
Smart CRO spending is about resourcefulness, not just resources. Budgets vary, but the result doesn’t: consistent investment in optimization is what separates companies with strong ROI from the rest.
- Some companies now devote as much as 30% of their marketing budget on CRO since it has a direct influence on sales. (Invesp)
- Prices range from $10 to $500 per month, with the average business spending about $2,000 monthly. Larger companies often invest significantly more. (Market.biz)
- Many companies hire CRO agencies, paying between $800 and $10,000 per month based on service scope. (Market.biz)
- The CRO software market was worth $771 million in 2018 and is expected to reach $1.93 billion by 2026, increasing at a steady 10% CAGR. (Market.biz)
- Companies report an average ROI of 223% from CRO tools. Some achieve over 1,000% returns, though about 5% fall below the average benchmark. (VentureBeat)
Average CRO Statistics Across Industries
The level of trust required and the decision-making processes of customers influence conversion rates, which differ by industry. The benchmarks below show current averages and how you can make a difference with tailored improvement.
- B2B eCommerce (1.8% avg.): Complex procurement procedures, higher budgets, and many decision-makers all contribute to lower rates. Custom pricing, sophisticated checkout flows, and live chat are all possible optimizations. (bloggingwizard)
- B2C eCommerce (2.1% avg.): Concentrate on eliminating friction during visitor checkout, mobile-friendly design, and tailored suggestions. (The Frank Agency)
- Professional Services (4.6% avg.): Trust drives conversions. Use testimonials, certifications, success stories, and optimized consultation forms. (Growtha)
- Finance (3.1% avg.): Slow due to complex decisions and regulations. Improve by simplifying forms, offering calculators, and clear educational content. (Meetanshi)
- Travel (2.4% avg.): Booking must be simple. Flexible policies, user-friendly design, and loyalty programs increase sales. (Contentsquare)
- Healthcare (3% avg.): Trust is critical. Showcase licenses, real patient stories, and easy scheduling. (Growtha)
- Legal Services (3.4% avg.): Clients seek competence and simplicity. Utilize case studies, testimonials, and shortened intake forms. (Electro IQ)
- Higher Education (2.8% avg.): Prospects need nurturing. Simplify applications into steps and use personal communication. (VWO)
Channel-Wise CRO Statistics
Conversion rates vary by channel, and traffic sources strongly affect outcomes. Here’s a look at averages and ways to improve them.
- SEO (2.1% B2C, 2.6% B2B): Creates constant traffic and conversions throughout time. Success requires responding genuine inquiries with high-quality content, optimizing for mobile, keeping content up to date, and getting reputable backlinks. (dashthis)
- SEM/PPC (1.2% B2C, 1.5% B2B): Requires regular optimization. Use focused keywords, relevant advertisements, and landing pages that meet expectations. Ad extensions increase clicks. (Reboot)
- Paid Social (2.1% B2C, 0.9% B2B): Stronger for consumers than businesses. Focus on precise targeting, test different formats, and monitor engagement. (FirstPageSage)
- Email Marketing (2.8% B2C, 2.4% B2B): A top-performing channel. Personalization, segmentation, automation, and A/B testing boost results. (FirstPageSage)
- Webinars (1.3% B2C, 2.3% B2B): Good for B2B interaction and authority. B2C companies may increase conversions with live styling sessions, promos, and demos. (FirstPageSage)
Landing Page Conversion Statistics
For generating leads and revenue, landing pages are essential. Evidence indicates that optimized pages consistently beat typical pages, however, outcomes vary by industry.
- General Benchmark: Most landing pages perform well if they reach a 2%–5% conversion rate. (LanderLab)
- Across all industries, the average landing page conversion rate is 9.7%—showing there’s plenty of room to grow with the right optimizations. (KlientBoost)
- E-commerce Landing Pages: Average 12.9% conversions, proving product-focused layouts are highly effective. (Landingi)
- Entertainment Landing Pages: Lead all sectors with an impressive 18.1% conversion rate. (Landingi)
- Marketer Priorities: 57% of B2B marketers see conversion rate as the most important metric when evaluating landing page performance. (Demandsage)
Core Conversion Rate Benchmarks
Conversion rates vary greatly by industry, platform, and device. The following benchmarks are the most essential metrics for determining overall performance.
- The average website conversion rate is 2%-5%, with the top 25% of sites achieving 5.31% or higher, and the top 10% reaching nearly 12%. (amraandelma)
- Conversion rates differ by device: desktops convert at 14%, while tablets average 3.36% and smartphones just 1.53%. (Revnomix)
- Across paid channels, Facebook ads average 9.21%, outperforming Google Ads at 3.75% and Instagram Ads at 1.5%. (WordStream) (madgicx)